Economics for IB: Summaries, lecture notes and practice exams - UG
- 2037 reads

Lecture notes written in 2015-2016 (Groningen, bachelor 1)
Economics is the study of how people make choices under conditions of scarcity and of the results of those choices for society. If we want do to more of one thing, we need to do less of another. The same counts for production. What standard economics assumes is that people are rational. In the sense that they would like to reach their goals as fast as they possibly can. Therefore we can use this for predicting real life events.
Resources are very limited, and having more of one good thing means having less of another. There is no such thing as a free lunch. Economists always think of explicit costs as well as implicit costs. Time is an implicit cost. There is always some implicit cost involved in everything.
Rationality translates in the cost benefit principle, where an individual ought to take action if, and only if, these extra benefits from taking these actions are at least as great as the extra costs related to it. So economists are not naïve, but we look at how well our models perform in predicting real life events, using this cost-benefit principle.
How much would you need to be paid to run an errand for a stranger which involved the same walk. How much does time mean to you? Is your time worth the discount or not?
Economic surplus is what you are willing to pay minus what it actually costs. For example: 30 minute walk to town to buy a game on discount = 9 euro. Discount = 10. Then economic surplus is 10-1 = 1 euro. You should only undertake an action if it creates an economic surplus.
The cost-benefit model is a simplified representation of reality, assuming that people behave in this way, and behave rationally, in choosing among competitive alternatives. It does very well in predicting what people do in their actual life. People experience day-to-day decisions, and the model does well in predicting what the outcome is. If it fails to predict outcomes in specific events, that’s when economists build new models.
There are four decision pitfalls, because people don’t always behave rationally:
People don’t always look at the total amount, but they count the benefit in term of a percentage. Some people therefore behave irrationally.
Ignoring opportunity costs. Example: taking a bus to town (costs a ticket) and implicit time (the time it takes to get to town) and then relating this to the discount.
Failure to ignore sunk costs: You buy a gym membership at the beginning of the year. You wonder if you should go to the gym or not? You have already paid it so it should not influence your decision, but people still let this influence them. ‘’ I have paid a lot of money for this so should I go or not?’’
Failure to understand the average – marginal distinction: The additional benefits that come through our decision. The focus should always be on the benefit and cost of an additional unit of activity.
Marginal costs: the additional total cost for every extra unit
Marginal benefit: the average benefit of every extra unit
Average cost: Total costs of an amount of units of an activity divided by that amount of units
Average benefit: The total benefit of an amount of units of an activity divided by that amount of units. Always look at marginal, don’t look at averages when being rational.
Microeconomics: Focuses very much on individual choice under scarcity. In individual markets.
Macroeconomics: Focuses very much on national economics, interest rates, unemployment, exchange rates.
Positive economics: If we do something what will happen? (independent of the ethical value)
Normative economics: If we start with a positive statement. Based on this what should we be doing, what should the government be doing? (based on ethical value)
Exchange is really the basis of economics. If you divide labor, people can specialize in those activities in which they are highly effective. Then people can exchange, and the income is higher. Absolute advantage means that one person earns more when spending an hour on performing a task, than another person can. Comparative advantage means that one person has a lower opportunity cost of performing a task than another person.
Specialization in tasks is more efficient, because it creates a higher outcome. Countries should focus only on activities of which their opportunity costs are lowest. On individual level comparative advantage can come from inborn talent, education, training and experience. On national level comparative advantages can come from land, labor, capital, entrepreneurship, knowledge, natural resources, cultural, legal and political institutions.
The PPC is a graph that shows the relationship between the quantity of one good that can be produced for every possible level of production of another good. You always measure what you lose for what you gain.
Attainable point
Unattainable point
Efficient points
Inefficient points
The principle of increasing opportunity cost is also referred to as ‘’the low-hanging-fruit principle’’. In this case, it is better to first employ those resources with the lowest opportunity costs when expanding the production of any costs, and only later start turning to resources of which the opportunity costs are higher.
Factors that shift the economy’s PPF: Increases in productive resources, improvements in knowledge and technology. They will cause economic growth and shift the PPF outwards.
Economic systems must address questions regarding what, how and for whom things will be produced.
The market demand curve is a graph that shows the quantity of a good that buyers would like to buy for every price. It is usually downward-sloping with regard to price. Usually as the price of a good or service goes down, customer demand will increase. As the price of a good or service increases, demand will usually drop.
There are three factors influencing demand:
- Substitution effect
- Income effect- Buyer’s reservation price
The supply curve shows the quantity of a good that sellers wish to sell at each price. The supply curve is usually upward-sloping, as the seller will charge a higher price for additional units as to cover the higher opportunity costs for each additional unit.
The seller’s reservation price is the lowest amount of money for which a seller would be willing to sell an additional unit (this is usually equal to the marginal cost). The market equilibrium is a situation in which all buyers and sellers are satisfied with their respective quantities at the prevailing market price. Therefore the equilibrium price is the price for which a good will be sold. The equilibrium quantity is where the supplied and demanded quantity are equal.
Excess supply is a situation in which there is more supply than demand of a certain product when the price of this product exceeds the equilibrium price. Excess demand is a situation in which the demand for a certain product is higher than the supply of this product when the price of this product lies below the equilibrium price.
The price ceiling is the maximum allowable price, which is specified by law. The price floor is the minimum allowable price, which is also specified by law.
A shift in the demand curve is what we call a change in demand, due to more buyers entering the market or a change in preference (a shift of the entire demand curve). A change in quantity demanded occurs when there is a price change (movement along the demand curve).
There is a change in supply due to a change in input costs, new technologies, innovation etc. (shift of the entire supply curve. A change in the quantity supplied results from a price change (movement along the supply chain).
A shift in demand can result from:
Complements:
Substitutes:
Income change:
A shift in supply can result from:
Surplus is economic benefit. We always want to maximize this as we are rational. We can distinguish between the buyer’s surplus, the seller’s surplus and the total surplus. Social optimal quantity occurs when the marginal cost equals the marginal benefit.
The lecture stopped at this point, therefore the other information can be found in the remaining slides on Nestor.
We speak of inefficient market equilibrium when some of the production costs fall on people rather than on the sellers of the good or service. An example of this is pollution, as people who have asthma might suffer from the effects of pollution that a product they have bought produced. Another example is vaccinations, because other people benefit from you getting vaccinated. This results in a higher societal benefit than individual benefit.
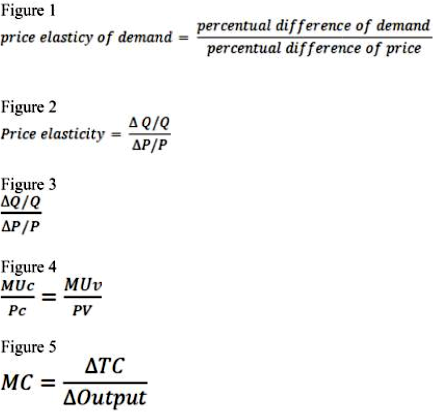
(See Attachment Figure 1)
1= Unit elastic
>1 = elastic
<1= inelastic
Some examples of determinants of demand price elasticity are substitution possibilities, budget share and time. When there are small changes in price, the following formula can be used:
(See Attachment Figure 2)
Slope = vertical intercept / horizontal intercept
Common error = elasticity = slope -> not true, because at each point in the graph price elasticity is different!
Perfectly elastic demand means that even a very slight increase in price would lead consumers to switch to substitute. A perfectly inelastic demand means that consumers can’t switch to alternates when the price of a product rises.
Total expenditure = P x Q
Total expenditure = Total Revenue
When price elasticity >1, changes in both price and total expenditures move in opposite directions.
When price elasticity <1, changes in both price and total expenditures move in the same directions.
Cross-price elasticity of demand happens when the percentual change in quantity demanded of a good in response to a 1 percent change in the price of another good.
-> Substitute goods
-> Complement goods
Income elasticity of demand is the percentual change in quantity demanded in response to a 1 percent change in income. For normal goods this elasticity is positive, for inferior goods this elasticity is negative.
Price elasticity of supply is the percentual change in the quantity supplied that occurs in response to a 1 percent change in price.
Price elasticity of supply = (See Attachment figure 3)
When there is a situation of perfectly inelastic supply, elasticity is zero. When there is a situation of perfectly elastic supply, elasticity is infinite.
The determinants of Supply Elasticity are:
The law of demand describes the behavior of people in terms of what they do, as the cost of doing it rises. Benefit of an activity = reservation price
When the reservation price is exceeded, less of the activity will be pursued.
Utility = The satisfaction people get from the activities they consume. We assume that people allocate their income in order to maximize their total utility.
Marginal utility = Additional utility gained from consuming an additional unit.
The Law of Diminishing Marginal Utility explains that the additional utility derived from consuming an additional unit diminishes, because the consumption increases beyond some point.
Optimal combination= the combination that causes the highest total utility.
(See Attachment figure 4) = Optimal spending rule, meaning that the way you spend things should be allocated across goods in such a way that the marginal utility per euro is the same for every good.
Preference ordering= A kind of scheme which will identify the preferences of an individual over various possible bundles of goods that might be consumed. There are a few things we assume:
We assume that preferences are ‘complete’, meaning that an individual can compare two bundles of goods and point out which one he/she prefers.
We assume that preferences are ‘ordinal’, meaning that we can rank the goods in terms of 1st 2nd 3rd 4th and so on.
We assume that preferences are ‘transitive’, meaning that there is a consistency in preferences. Good A > Good B. Good B > Good C. Therefore Good A > Good C
We assume that the satisfaction level of the individual is ‘increasing’ in any good. In other words, ‘more is better’.
We assume that preferences are ‘continuous’, meaning that an individual can compare and evaluate the utility of bundles of units that will only differ slightly, for example in size or even composition.
Altogether, these assumptions allow us to write down consumer preferences in the form of a Utility Function for a bundle of goods. It allows the consumer to be willing to ‘trade’ some of good X, when he gets more of good Y whilst maintaining his utility level. There is another assumption .
We assume that preferences display a so-called ‘’Diminishing Marginal Rate of Substitution’’. -> When you have 100 apples and 100 oranges, you will trade one-to-one. But when you have 190 apples and only 10 oranges, you may trade one orange for 20 apples.
An indifference curve is a smooth convex curve that provides the combinations of two goods for which the individual is different. The Marginal Rate of Substitution, also referred to as MRS, between two goods will provide the slope of the indifference curve.
The following formulas are related to the Indifference curve:
- Pb/Pa = MRSab = MUb/MUa
- Therefore Pb/Pa = MUb/MUa which equals MUa/Pb
Pb/Pa is the slope of the budget constraint
MUb/MUa is the slope of the indifference curve, where MU is the marginal utility
MRS is the marginal rate of substitution
The market demand curve can be derived from multiplying every quantity on the individual demand curve by the amount of consumers in the market.
Consumer surplus = the difference between a consumer’s reservation price for a product and the price that was paid.
Shutting down means that a company stops producing.
The law of diminishing returns is the relationship between output units and the number of (for example) workers hired. When some production factors are fixed, like machines, increasing production will at some point need even more increase in the variable factor (like workers).
Fixed factor of production is for example a bottle-making machine. A variable factor of production is for example labor.
Fixed costs do not change even if the output increases/decreases. Variable costs go up/go down for every unit of production (variable cost per unit). The total cost is the sum of fixed and variable costs.
Marginal cost is the change in total cost divided by the change in output as output changes from a certain level to another.
(See Attachment Figure 5)
Average total cost (ATC) is calculated by dividing total cost by total output.
Average variable cost (AVC) is calculated by dividing variable cost by total output.
ATC is always more than AVC because it includes fixed costs. Average fixed costs will go down with a higher quantity as ‘Q’ (quantity) increases. That is why in an MC curve the ATC and AVC line will grow closer to one another.
MC always goes through the minimum of ATC where MC=ATC. The average costs per unit will go down as long as the marginal costs of the next units are below the average costs per unit.
Profit is that what remains when total costs are subtracted from revenues. The goal of a profit-maximizing firm is to maximize the difference between TC and revenues. In a perfectly competitive market not a singular supplier has influence on the market price of the product. Price takers are firms that have no influence over the price at which the firm sells its product. Imperfectly competitive firms are firms that have at least a little influence over the prices at which the firms sell their product.
When there is a situation of perfect competition, all companies offer the same standardized product, there are many buyers and sellers, productive resources are mobile and buyers and sellers are well informed.
A firm must always be able to cover its variable costs, or else it will create immense losses. A short-run shutdown counts when PxQ < VC for every level of Q,
or when P < minimum value of AVC
A firm will always increase its profits, as long as MR>MC.
Profits = TR – TC = (P x Q) – (ATC x Q).
So in order to stay profitable, P > ATC
The optimal amount of production is when Price (marginal revenue) = marginal cost. Profit is equal to (P – ATC) x Q
When P > MC, a firm can increase its profit by expending production. When P < MC, a firm can increase its production by selling less units.
There is a negative profit when P < ATC.
Consumer surplus is the difference between the reservation price of a seller and the actual market price.
Chapter 6
In a situation of market efficiency there will be a market equilibrium, and no further transaction is possible that will help some other without harming others (Pareto efficiency).
Markets are efficient if buyers and sellers are well informed, when markets are perfectly competitive, when the demand and supply curves satisfy other restrictions and when transaction costs are low.
Deadweight loss occurs when there is a reduction in the total economic surplus, as a result of adopting a policy ( for example a tax).
Chapter 7
The invisible hand theory proposes the idea that actions of independent buyers and sellers will most likely result in a very efficient allocation of resources.
Explicit costs are payments that a company makes to its factors of production and other suppliers. Implicit costs are opportunity costs of the resources supplied by the company’s owner.
Accounting profit= total revenue – explicit costs
Economic profit= total revenue – explicit costs – implicit costs
Normal profit= accounting profit – economic profit
When accounting profit = opportunity costs of resources, the company’s economic profit is zero.
When being in a competitive market, all companies will be likely to earn zero economic profits in the long run, as a consequence of price movements that were caused by entries and exits of companies that were trying to maximize their economic profits.
There are various types of imperfect competition:
- Pure monopoly: no substitutes and only one supplier of a (unique) product
- Oligopoly: A few firms on a market that produce products that are relatively close substitutes.
- Monopolistic competition: A lot of companies that produce products that are differentiated and that are also quite close substitutes for one another.
The difference between perfect and imperfect competing firms is that for a perfectly competitive firm the demand is horizontal, meaning that there is a perfectly elastic demand. For a imperfectly competitive firm the demand curve has a downward slope.
There are several demands for a market to have perfect competition:
- Supply and demand determine equilibrium price
- The company has no market power
- The company sells all it wishes at the equilibrium price
……
Next to that, during imperfect competition, a company has some control over price or market power, and there the demand curve is downward sloping.
In order to measure market power, we can use a concentration index, which is called the Hirschman-Herfindal Index(HHI= sum squares shares of firms in the market.
The lerner index -> - L = (P-MC)/P
During both perfect competition and monopolies, output is increased when MR>MC.
MR=P in perfect competition
MR < P in a monopoly
MR declines when quantity increases, meaning that the price should be lowered to sell an additional unit; MR < P.
Monopoly: The decision rule entails that output increases when MR > MC
Output reduces when MR < MC
And that profits are maximized when MR = MC
Price discrimination means that different buyers asked to pay different prices for the same good/service, e.g. student OV.
A monopolist that perfectly discriminates asks each buyer to pay the exact same reservation price. There are, however, several limitations to this theory. For example, there is the possibility of reselling, and there might be information on very single buyer’s reservation price.
Market power means that a company has the ability to increase the price without losing all its sales due to e.g. exclusive control over inputs, patents and copyrights, government licenses or franchises, economies of scale and network economies.
When a company has a lot of fixed costs and relatively low variable costs, this company will have low marginal costs (MC), a sharply declining average total cost as output diminishes and economies of scale.
The theory of games means that there are many actions that the payoff depends on several things, e.g. the actions themselves, when these actions are taken and how these actions are related to those that are being taken by others.
The basic elements of the game are:
The players
The strategies that are available to every single player
The payoffs that each player receives for every possible combination of strategies
The dominant strategy is a strategy that will result in a higher payoff, no matter what another player in a game picks.
The dominated strategy is a strategy that is available to a player who has a dominant strategy.
The prisoner’s dilemma is a situation in which every single player has a dominant strategy and when they play this the resulting payoffs will be smaller than if they had played a dominated strategy.
The Nash equilibrium is a combination of strategies, which will result in every competing player’s strategy is the best choice, given the strategy of another player.
In the repeated prisoner’s dilemma, the same players are confronted repeatedly, which will result in an increase in cooperation.
In the tit-for-tat strategy for the first move the players will cooperate, however, if one still ‘’cheats’’, the other will change next time as well (he will copy).
In the ultimatum bargaining game, the first player has the power to confront the second player with a take-it-or-leave-it offer.
Having a commitment problem means that people are not able to achieve their goals, because they are unable to make credible threats or promises. A solution to this is a so-called commitment device, which is a way of changing incentives in order to make otherwise empty threats of promises credible.
The lecture ended at this point, therefore the further slides will be discussed during next week’s lecture.
A cartel is the working together of companies, and they agree to restrict output in order to earn an economic profit. There one big reasons for the breaking down of cartels:
Cheating in a cartel (one firm decides to price-cut as it will increase his output, resulting in a bigger profit. The other firm will respond then by undercutting, resulting in a prisoner’s dilemma. A cartel can prevent cheating by changing the payoffs, for example by changing the expectations as to other’s behavior or by limiting the opportunity of the member to cheat.)
In order to understand how firms interact in special circumstances one has to identify the best response of a player to any choice of the other. This best response is described as a reaction function. In a situation where a company maximizes its profits, the best response is the one that gains the highest profit.
There are two very famous models of oligopoly:
Cournot model: market where firms choose output levels. This is an example of a duopoly, meaning that there are two producers in the market, and where we assume that these producers have highly substitutable products, have the same technology and the same input costs and constant unit costs and a straight line market demand curve. Residual demand is demand that could be met by the company if it decides to produce output and sell it. Cournot point e is Nash equilibrium, so where the two curves intersect.
Bertrand model: market where firms decide on price. The Bertrand Paradox is that for two similar companies, that produce highly substitutable output, the Nash equilibrium in prices is P=MC, meaning that as long as there are two or more players, the perfectly competitive price emerges. There are three situations for which the paradox does not count:
The companies understand that the short-term profit from undercutting will result in falling profits in the long-term.
Product differentiation means that the products of the companies are not highly substitutable.
There are two types of externalities:
External costs (negative): A cost of an activity that falls on people besides from those who pursue the activity.
External benefit (positive): A benefit of an activity that is received by people besides from those who pursue the activity.
It is very important to keep in mind that in an inefficient resource allocation the situation can be rearranged in such a way that would still make some people better off without hurting others. The Coase theorem states that if trade in an externality is possible and there are zero transaction costs, bargaining will lead to an efficient outcome.
The ‘tragedy of the commons’ is the tendency for a resource that has no price, to be used until the point that its marginal benefit drops to 0.
Positional externality happens when an increase in one person’s performance diminishes the expected reward of another, meaning that payoffs depend on relative performance. Examples of positional externalities are positional arms race and positional arms control agreement.
As the invisible hand theory has already been discussed, we know that it assumes that buyers are transparent, meaning that they are fully informed on how to spend their money. We also know that in reality this is not always true, as buyers might not always be rational.
This theory linked to information economics. For example, we are concerned with questions like: ‘’What is the optimal amount of information?’’.
The free rider problem is an externality issue, meaning that is a situation in which not enough goods/services are produced because non-payers are not excluded from using the good/service. This will lead to others benefiting from actions that you have taken and that are costly to you. There are two guidelines for rational information searching:
Additional search time is more likely to be worthwhile for expensive items than cheap ones.
Prices paid will be higher when the cost of a search is higher.
There are always additional costs and uncertain benefits involved with engaging in further search, meaning that there is a certain risk of gamble from the search. In order to determine whether or not to gamble, one has to calculate the expected value, which is the sum of the possible outcomes x their respective probabilities. A fair gamble is one of which expected value is zero. A better than fair gamble is one of which the expected value is positive.
There are two attitudes that on can has to risk (determining whether to take the gamble or not):
A risk-neutral person is someone who will accept any gamble that is fair or better.
A risk-averse person is someone who will refuse a fair gamble
Asymmetric information is a situation in which a buyer and seller are not equally informed about the features of products/services, or each other’s behavior.
The market for lemons model assumes that asymmetric information tends to reduce the average quality of goods offered for sale.
In order to communicate high quality, we can use the costly-to-fake-principle, which assumes that in order to communicate credibly, a certain signal must be costly or difficult to fake (e.g., giving a 6 month warranty)
Adverse selection is a pattern in which insurance tends to be purchased disproportionally by those who are most costly for companies to insure. The results of this are raised premiums, the reduced number of low-risk policy holders and the increased risk level of the insured.
Moral hazard is the tendency of people to spend less effort protecting those goods that are insured against theft or damage. Its excesses are used to reduce moral hazard and adverse selection.
Statistical discrimination often goes hand in hand with what we think of as discrimination. It is actually something rational, and it does not need to be accompanied with any bad feelings. For example, you are in a market and you know that people from province a are less trained at something than people from province b. Therefore it is hard to find out if someone from province a is actually highly skilled (when we assume that 80% is not skilled). Therefore it is more rational to only hire people from province b. It leads to a negative outcome, as people from province a notice that they are not being hired anyway. They will therefore not get skilled anyway, and not invest in e.g. education.
Chapter 13 – Labour markets, income distribution, wealth and poverty
In the market for labour we assume that equilibrium wage and quantity are determined by the supply and demand of a specific category of labour. Therefore changes in supply and demand will change the equilibrium wage and quantity.
The value of marginal product (VMP) is the money value of the additional output a firm gets by employing one extra unit of labour. Wage = VMP.
Human capital theory is one of pay determination that says the wage of a worker is going to be proportional to the value of her stock of human capital.
Human capital are all factors that affect the value of a worker’s marginal product, e.g., education, training and experience.
Monopsony’s are kind of similar to monopolies, but only they are the only buyer of labor on the labour market. It is very theoretical, and the monopsony depends on violations of four basic competitive market assumptions:
There are many other jobs around for the same wage
Workers are fully informed about location ages of other firms
Workers can instantly switch from one job to another
Workers can costlessly switch employers and locations.
A trade union is a group of workers that bargains collectively with employers for better wages and working conditions.
Winner-take-all markets are labour markets in which only small differences in human capital will ultimately translate into large differences in pay (e.g. artists, sports).
The Gini coefficient and Lorenz curve are tools to measure the distribution of income or wealth. The first is a measure of equality of distribution that compares the actual distribution with a benchmark of absolute equality, whereas the second is a graph of the cumulative distribution of income/wealth by percentages form poorest to richest.
The coefficient of the gini index is: A / (A + B)
There are several ways in which the government is present in the economy. For example, the government takes care of the provision of goods and services, e.g., police, education and health care. Next to that, the government also regulates the market in some sort of way, as it has set a legal system, has made deals with labor market institutions, has set rules for health and safety regulation, and controls price controls and mergers regulations.
A public good is –to some extent- both a non-rival good and a non-excludable good. The first is a good of which its consumption by one person does not result in less availability for others. The second is a good that it is difficult to exclude non-payers from consuming, like fireworks.
A pure public good is a good/service which is both non-rival and non-excludable, e.g., air broadcasted TV. A collective good is a good/service which, to some extent, is non-rival but excludable, like cable TV. A pure private good is a good/service for which non-payers can easily be excluded. A pure common good is a good/service for which non-payers cannot easily be excluded.
Poll tax is a tax that collects the same amount from every taxpayer. Regressive tax is a tax under which the proportion of income paid in taxes declines as income rises. Proportional income tax is a situation in which all taxpayers pay the same proportion of their incomes in taxes. In a progressive tax system the proportion of income paid in tax increases as the income increases.
A pure public good must only be provided by the government when the benefit exceeds the cost of this public good, where the cost of the public good is the sum of the explicit and implicit costs incurred to produce it, and where the benefit of the public good is the sum of the reservation prices of all people who want to make use of the good.
Regulation is a legal intervention in markets to alter the way in which firms or consumers behave.
 Economics for IB - international business
 Lecture notes written in 2015-2016 (Groningen, bachelor 1)
Economics is the study of how people make choices under conditions of scarcity and of the results of those choices for society. If we want do to more of one thing, we need to do less of another. The same counts for production. What standard economics assumes is that people are rational. In the sense that they would like to reach their goals as fast as they possibly can. Therefore we can use this for predicting real life events.
Resources are very limited, and having more of one good thing means having less of another. There is no such thing as a free lunch. Economists always think of explicit costs as well as implicit costs. Time is an implicit cost. There is always some implicit cost involved in everything.
Rationality translates in the cost benefit principle, where an individual ought to take action if, and only if, these extra benefits from taking these actions are at least as great as the extra costs related to it. So economists are not naïve, but we look at how well our models perform in predicting real life events, using this cost-benefit principle.
How much would you need to be paid to run an errand for a stranger which involved the same walk. How much does time mean to you? Is your time worth the discount or not?
Economic surplus is what you are willing to pay minus what it actually costs. For example: 30 minute walk to town to buy a game on discount = 9 euro. Discount = 10. Then economic surplus is 10-1 = 1 euro. You should only undertake an action if it creates an economic surplus.
The cost-benefit model is a simplified representation of reality, assuming that people behave in this way, and behave rationally, in choosing among competitive alternatives. It does very well in predicting what people do in their actual life. People experience day-to-day decisions, and the model does well in predicting what the outcome is. If it fails to predict outcomes in specific events, that’s when economists build new models.
There are four decision pitfalls, because people don’t always behave rationally:
People don’t always look at the total amount, but they count the benefit in term of a percentage. Some people therefore behave irrationally.
Ignoring opportunity costs. Example: taking a bus to town (costs a ticket) and implicit time
 Summaries and study services for International Business Bachelor 1 at the University of Groningen
JoHo can really use your help! Check out the various student jobs here that match your studies, improve your competencies, strengthen your CV and contribute to a more tolerant world
There are several ways to navigate the large amount of summaries, study notes en practice exams on JoHo WorldSupporter.
Do you want to share your summaries with JoHo WorldSupporter and its visitors?
Field of study

JoHo kan jouw hulp goed gebruiken! Check hier de diverse studentenbanen die aansluiten bij je studie, je competenties verbeteren, je cv versterken en een bijdrage leveren aan een tolerantere wereld

Je vertrek voorbereiden of je verzekering afsluiten bij studie, stage of onderzoek in het buitenland
Study or work abroad? check your insurance options with The JoHo Foundation


Add new contribution