These are the workgroup excersises of lecture 1 on 05/09/18
Introductory exercises
- What is the empirical cycle? ( Describe each of the phases briefly)
- What is a dependent variable?
- What is an independent variable?
- What are the two definitions within a study?
- What are the formulas for SS(total), SS(within) and SS(between)
- What is the relationship between these fomulas?
- Describe briefly the meaning of s2y, N, y, yij, nj and Σ ?
- What is variance?
- What is the meaning of variance accounted for (VAF) and what is the formula for it?
Exercise 1
You are conducting a study about the differences in grades between boys and girls. In this study, you have six participants, three girls (G), and three boys (B). The data is given in the table below.
| Style | i | j | Score | (yij - y) | (yij - y)2 | yj | (yj - y) | (yj - y)2 | (yij - yj) | (yij - y)2 | y |
| G | 1 | 1 | 9 | | | | | | | | |
| G | 2 | 1 | 8 | | | | | | | | |
| G | 3 | 1 | 7 | | | | | | | | |
| B | 1 | 2 | 5 | | | | | | | | |
| B | 2 | 2 | 4 | | | | | | | | |
| B | 3 | 2 | 6 | | | | | | | | |
| | | | | | | | | | | | |
- Calculate SS(total)
- Calculate SS(between)
- What are the two ways of calculating SS(within)
- Find the total, systematic and error variance.
Answers
Introductory exercises
- The empirical cycle is the process every study goes through and consists of five phases. Observation: the start of an idea for a research question. Induction: forming a general theory for your study. Deduction: specifying the study and forming your specific research hypothesis. Testing: Performing your experiment and gathering results. Evalution: What do the results say about your theory?
- The dependant variable is that what is affected by the experiment.
- The independant variable is that what causes change in an experiment.
- Conceptional, meaning 'what is it?' and operational, ' how do I measure it?'
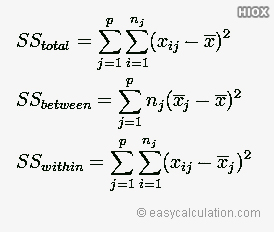
- SS(total) = SS(within) + SS(between)
- s2y = variance, N = number of observations, y = the grand mean, yij = the score of person i in group j, nj = number of observations in group j and Σ = addition
- Variance is the measure of variability
- VAF = the amout of systemetic variance withing the total variance. The formula = systemetic variance/total variance
Excersise 1
| Style | i | j | Score | (yij - y) | (yij - y)2 | yj | (yj - y) | (yj - y)2 | (yij - yj) | (yij - y)2 | y |
| G | 1 | 1 | 9 | 2,5 | 6,25 | 8 | 1.5 | 2,25 | 1 | 1 | 6,5 |
| G | 2 | 1 | 8 | 1,5 | 2,25 | 8 | 1,5 | 2,25 | 0 | 0 | 6,5 |
| G | 3 | 1 | 7 | 0,5 | 0,25 | 8 | 1,5 | 2,25 | -1 | 1 | 6,5 |
| B | 1 | 2 | 5 | -1,5 | 2,25 | 5 | -1,5 | 2,25 | 0 | 0 | 6,5 |
| B | 2 | 2 | 4 | -2,5 | 6,25 | 5 | -1,5 | 2,25 | -1 | 1 | 6,5 |
| B | 3 | 2 | 6 | -0,5 | 0,25 | 5 | -1,5 | 2,25 | 1 | 1 | 6,5 |
| | | | 39 | 0 | 17,5 | | 0 | 13,5 | 0 | 4 | |
- 17,5
- 13,5
- SS(within) is 4
- total = 3,5, systematic = 2,7, error = 0,8
These are the workgroup excersises of lecture 2 on 12/09/18
Introductory excersises
- What is a variable?
- When is a variable mutually exclusive?
- When is a variable exhaustive?
- Which five measurement levels can be distinguished?
- What types of bias can occur in self-reports?
- What are probability samples and which four types can be distinguished?
- What are non-probability samples and which three types can be distinguished?
- What is a sampling frame and why is it useful?
Excersise 1
For this, pick out a random questionaire from the internet and analyse it to test your knowledge. Keep into consideration:
- Do all the variables fullfil the requirements of mutual exclusivity and exhaustiveness?
- What is the level of measurement of each variable?
- Are there any questions that might be suseptible to any self-report bias?
- How can this be solved?
- Can you see what kind of sampling is being used?
- What is the sampling frame?
Excersise 2
There are two research applying for a study. Researcher A is interested in to what extend people in The Netherlands suffer from depression and how severe their symptoms are. Researcher B wants to see which treatments are being uses at the moment for people who have 'bipolar disorder'.
Identify for each of the two researchers what population they are studying, what their sampling frame is, howthey might get their hands on it and which sampling method would be most appropriate.
Answers
Introductory exercises
- A variable is the measurement that varies in value of a level.
- When there is no overlap between scores.
- When no oneor nothing is excluded from the values.
- Nominal, ordinal, interval, ratio, absolute.
- Social desirability, acquiescence and nay-saying response style
- Each individual has the exact same, fixed probability. The four types are: simple random, systematic, stratified random and multistage cluster
- The probabilities between people are not fixed and can vary. Three types are: Convienience, quata and purposive.
- It's a list of all individuals in a population and it can help you pick your sampling group.
Excersise 2
Researcher A: The population is everyone in The Netherlands. The sampling frame is everyone living in The Netherlands and they might obtain is through a governmental institution. The sample method would be multistage cluster sampling.
Researcher B: The population is everyone with a bipolar disorder in The Netherlands. This is also the sampling frame and might be obtained through therapists or hospitals. The sample method would be stratified random sampling.
For the exercises and information from week 3 and 4, You need to be in possesion of the IBM SPSS Statistics 25 program on a computer or laptop.
How to work the SPSS basics
- When starting SPSS, it always opens two windows, your Data Editor and yoor Output Window. Never close either of them without saving, but especially not the Output Window, as it shows all the changes you have made to your Data Editor file.
- The Codebook is your best friend. It's a table that shows you exactly what your variables mean and what their values are. Before starting any SPSS work, make sure you first look at the codebook.
- When editing your variables, go to variable view (bottom left) and identify your variable under 'name'. Under 'type', you can decide whether your variable is numeric, such as a score of a test, or string, meaning there is a worded meaning behind it, such as gender.
- Important is that SPSS works with numbers, and you have to tell it what those numbers mean. Under 'values', you can define what each number means. (E.g. 1=female, 2=male, 9=unknown)
- A missing value is when a responded has been unclear on a question of didn't answer it. They are usually defined with a special number and your codebook will tell you what that number is. If you want SPSS not to count those numbers in with calculations, you go to 'missing', click 'discrete missing' and define the number(s) as a missing value.
Practise
Start up SPSS and put the following Data in the program
| ID | V1 | V2 | V3 | V4 |
| 1 | 1 | 70 | 1.78 | 1 |
| 2 | 2 | 55 | 9.99 | 4 |
| 3 | 9 | 73 | 1.75 | 2 |
| 4 | 2 | 999 | 1.70 | 3 |
Define the variable labels, the value lables and the missing values, using the codebook.
| Name | Type | Label | Values/Missing |
| ID | Num | Respondent number | |
| V1 | Num | Sex | 1=female, 2=male, 9=unknown |
| V2 | Nem | Weight in kilograms | 999=unknown |
| V3 | Num | Height in meters | 9.99=unknown |
| V4 | Num | 'I love Brussels' | 1=strongly agree, 2=agree, 3=undecided, 4=disagree, 5=strongly disagree, 9=unknown |
Sorting, selecting and splitting
- To Sort data, go to 'data' (4th label up top). Press on 'Sort Cases' and drag the variable you want sorted into the box. Press either ascending or descending and click OK
- To Split data, go to 'data', 'split file' and click on 'compare groups'.
- To Select data means that you want SPSS to only take certain data into consideration. Go to 'data', 'select cases' and click the 'If condition is satisfied'. This allows you to tell SPSS when and when not to count in data.
- To create charts, go to 'graphs' (7th label up top). There, press the chart builder and drag from the gallery the type or chart that you want. Identify the variables on the x and y axis and press ok. THe chart will now show in your output window.
Practice
Try out selecting, splitting and sorting in the file you just made. Then, make a bar chart. Save the file as test.sav afterwards
For this tutorial, you will need the IBM SPSS Statistics 25 program.
Case summaries, frequency tables and descriptive statistics
- To make a case summary, go to 'analyse' (6th label up top) and go to 'report'. There, you will see 'case summary' and you can decide of which variables you want to see a summary of. After pressing 'ok', the summary will appear in your Output Window.
- To make a frequency table, go to 'analyse' and then 'descriptive statistics'. There, you will find 'frequencies'. Select the variable you want to know the frequency of and press ok. If you want to find a certain frequency distribution, go to 'options' and select your distribution before pressing ok.
- To get descriptives such as the mean or median, go to 'analyse' and then 'descriptive statistics', where you can see 'descriptives'. Choose your variable and press 'options'. Here you can decide exactly which descriptives you want. Then press ok.
Practise
Open the test.sav file and create at least 4 more fictional variables of different types of values, one of which being age, and 4 more respondents. Then, find the mean of the weight of all eight respondents and show the Q1 and Q3 of the frequencies.
Boxplots, computing and recoding
- With a boxplot, you can also show the frequency distributions or descriptives. Go to 'Graphs' and make a boxplot. Keep in mind that you can select either a single boxplot or multiple ones. With the latter, you can also show that difference between groups. To change a visual thing about the boxplot, such as the colour, press on the graph and an editor window will pop up.
- When you want to compute a variable, go to 'transform' (5th op top) and select 'compute variable'. Here, you can decide which variable you want to make into something else, or what you want to know.
- Redoding means that you are changing the values of a variable into something new. Go to 'transform' and then 'recode into differnet variables'. Select which variable you want to recode, what the new name will be and then press 'Old and new values...' Here you an tell SPSS exactly what old variable turns into what new one.
Practise
Make a purple box plot of you test.sav file. Then, compute a variable for the age in months and put the 'I love Brussels' variable into catergories, (strongly) disagree now being 1, undecided being 2 and (strongly) agree being 3.
Introductory exercises
- What is a normal distribution?
- What is the meaning of µ, σ, P, ¯x, sx, <, and ≥?
- What is the effect of standardizing on the parameters of a distribution?
- Why is it useful to standardize a variable and what is the effect of standardizing on the shape of a distribution?
- What is a z score and how do you calculate it?
- How could you calculate the X of a z-score?
- What is the 68-95-99.7% rule?
Practise
An psychologist has developed an instrument to measure CEO qualities in people. The scores of 800 managers have approximately a normal distribution with µ = 34.00 and σ = 7. Five of these scores are in the table below.
| Respondend nr. | X | zx | P(Z<z) | P(Z ≥ z) |
| 1 | 30 | | | |
| 2 | 38 | | | |
| 3 | 46 | | | |
| 4 | 60 | | | |
Answers
- A normally distribution has a big amount of average scores, with very few high or low scores. It is always symmetrical and normally skewed.
- µ = the mean, σ = the standard deviation, P = probability, ¯x = the mean of x, sx = standard deviation of x, < = smaller than, and ≥ = bigger than or equal to.
- µ = always 0 and σ = always 1
- To make sense of the data you have been given without any context. The shape of the distribution does not change with standardizing.
- Z- score is a way of standardizing and the formula is

- Reformulate the formula to X = µ + z * σ
- Between -1 and +1 standard deviation is 68% of the curve. Between -2 and +2 is 95% and -3/+3 is 99.7%. This is often referred to as the 68-95-99.7% rule.
Practise answers
| Respondend nr. | X | zx | P(Z<z) | P(Z ≥ z) |
| 1 | 30 | -.57 | .2843 | .7157 |
| 2 | 38 | .57 | .7157 | .2843 |
| 3 | 46 | 1.71 | .9564 | .0436 |
| 4 | 60 | 3.71 | >.9998 | <.0002 |
Introductory questions
- Which graph can show association between two variables?
- How can you describe the association between variables?
- What influence can outliers have on the association between variables?
- What is the meaning of the following symbols: ¯x, ¯y, sx, sy, sxy and rxy?
- How do you calculate the covariance?
- What are the two formulas for calculating Pearson r and which values can it have? What is the rule of thumb for Pearson r?
- What is the formula for calculating z scores?
Practise
A psychologist studied the ways in which children learn to calculate. In a random sample of 9 children in the ages between 7.5 and 8.0 years old he studied a child’s mental age, X, and his or her math ability, Y. The data can be found in the table below.
| Resp | X | y | Sex | Class |
| 1 | 6.5 | 16.5 | M | 1 |
| 2 | 8.5 | 21.0 | F | 2 |
| 3 | 7.0 | 22.5 | F | 3 |
| 4 | 5.5 | 18.0 | M | 1 |
| 5 | 10.0 | 24.0 | F | 3 |
| 6 | 8.0 | 22.5 | M | 2 |
| 7 | 6.5 | 19.5 | M | 1 |
| 8 | 8.0 | 21.0 | M | 3 |
| 9 | 7.5 | 24.0 | F | 3 |
- Draw the scatterplot of the relationship between X and Y.
- Formulate a conclusion about the association between mental age and math ability.
- Aaccommodate a third variable in the scatterplot.
- Describe the relationship between X and Y for the boys and girls separately while in the same scatterplot.
Answers intro questions
- A scatterplot
- Direction, strength and shape
- Outliers can heavily influence correlation is they are located far from the others.
- ¯x = mean of x, ¯y = mean of y, sx = standard deviation of x, sy = standard deviation of y, sxy = standard deviation of x and y / covariance of x and y andn rxy = pearson's r of x and y
- Sxy = ∑ (xi - x)(yi - y)/ (N - 1)
- rxy = ∑ zxzy / n - 1 or rxy = sxy / sxsy
- Z = X - µ / σ
For this tutorial, you will need the IBM SPSS Statistics 25 program
Introductory questions
- Which three models are used to explain a relationship between two variables?
- What is a normal distribution?
- What is the effect of standardizing on the parameters and the shape of a distribution?
- Which graph is suitable for displaying the association between two variables?
- With which aspects would you describe the association between two variables?
- What are outliers and in what way can they influence the association between two variables?
- Which values can the Pearson r have?
Practise
Determine whether the relationship between x and y is causal, common response or confounding, in the following three situations.
- x = grade for Introduction to Psychology, y = grade for Introduction to Research Methods & Statistics
- x = the salary that a person earns, y = the amount of money a person is able to save each month
- x = political affiliation of the mother, y = political affiliation of the child
- x = therapy intensity, y = the seriousness of a patient’s symptoms after treatment
SPSS
When you want to change the number of classes in, for instance, a histogram, open the Chart Editor. Press options, then choose 'Bin Element'. There you can choose a custom interval.
A Q-Q plot can tell you whether or not a distribution is (approximately) normal. To get SPSS to make a Q-Q plot, go to Analyse, then Descriptive statistics. There, you will find Q-Q plot. If you want the Z-scores, to to Analyse, then Descriptives and check the box that says 'save standardized scores.'
If you want to calculate Pearson's r, go to Analyse and look down to Correlate. There, you can find 'Bivariates", where you can put a check with Pearson's r. Don't forget to got to options, where you can find 'exclude cases pairwise' and 'exclude cases listwise'. Pairwise will leave out any pair with an 'unknown' variable, listwise will leave out anything with an 'unknown variable'.
Answers Intro questions
- Causality (X causes Y), Common response (X and Y cause Z) and Confounding (X and Z influence Y)
- A normally distribution has a big amount of average scores, with very few high or low scores. It is always symmetrical and normally skewed.
- You can make sense of the data you have been given without any context. µ = always 0 and σ = always 1. The shape of the distribution does not change with standardizing.
- Scatterplot
- Shape, strenght and direction
- Outliers can heavily influence correlation is they are located far from the others.
- Between -1 and +1
Answers practise
- Common response
- Causal
- Confounding
- Common response
Introductory questions
- What is the Testing effect?
- What is the Sensitization effect?
- What is the History effect?
- How does it differe from the Maturation effect?
- What is the Selection effect?
Practise for the exam
Make a 'cheat sheet' for the normal statistics test. Try to fit as much of the important information on the two sides of an a4 sheet. This really helps you sort through the information and study at the same time.
Practise in SPSS! Practise, practise, practise, this is the key through working it out. Make a list for all the steps you have learned so you have a clear over view.
Answers
- Testing = effect of pretest on Y
- (Pretest) Sensitization = interaction pretest x treatment, because of the pretest, participants become more aware of the treatment
- History = an event happing that changes sometihng with the participant
- Maturation = changes within participants, such as growing up or practise, while history is more of a one time event
- Selection = biased assignment of participants, based on the judgement of the examiner
- Week 2: The absolute measurement level is vary rare and will almost never occur, which is why some books leave it out all together. The chances you will come across it is very rare and when you do, it will almost always be in the form of probabilities.
- Week 3: Always put the missing value in both the 'value' category as well as the 'missing'.
- Week 4: When computing, make sure you do not put a space in the name of the new value, because SPSS doesn't take that.
- Week 7: Do not forget to uncheck 'save standardized...' the next time you use 'Descriptives', or else SPSS will continue to create z-scores, which can get really confusing.


Add new contribution